Frequency Tables
- The table() function is used to find the frequency/observation count for each level of a variable
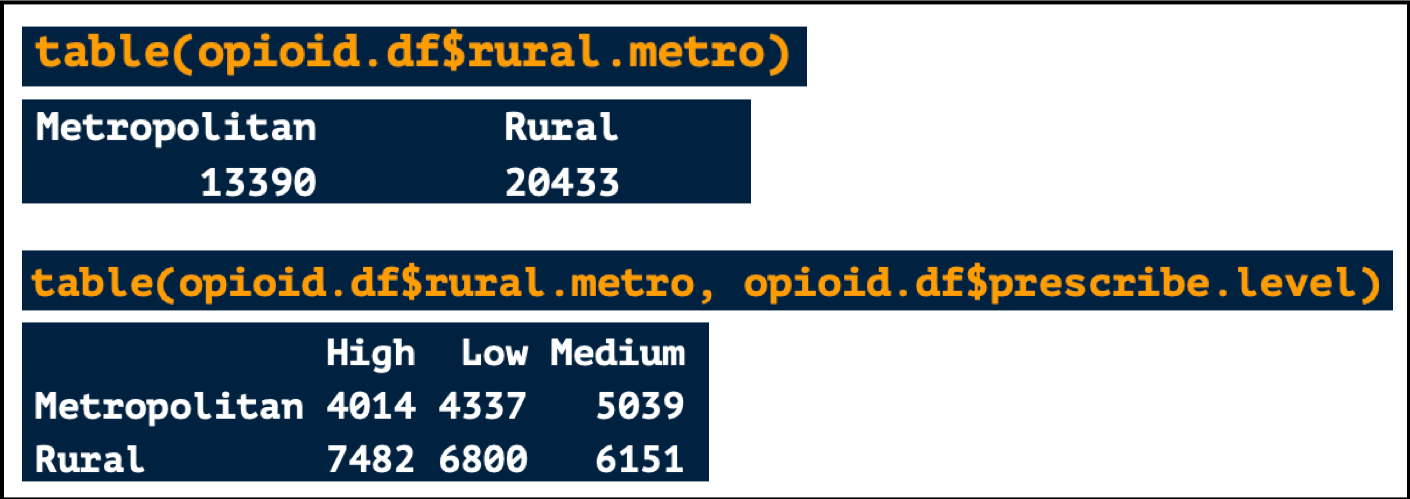
- For example, above you see that there were 13390 Metropolitan counties and 4014 Metropolitan counties with a high prescribing rate
length() and unique()
- The unique() function will extract all the unique values from a vector
- Example: The unique years in the opioid.df data frame are shown below

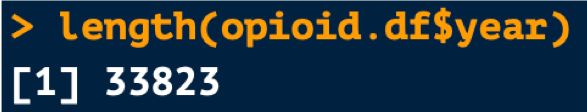
- The length() function will tell you the length or number of values in a vector
- Example: The year column within opioid.df has 33,823 values
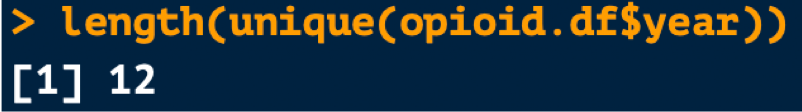
- You can combine both functions to tell you the number of unique values in a vector
- Example: There are 12 unique years values within opioid.df
Counting the Number of Rows and Columns
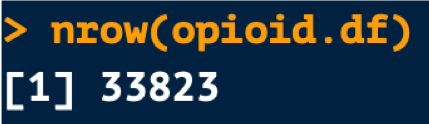
- nrow() tells the number of rows in a data frame
- Below we see that opioid.df has 33,823 rows
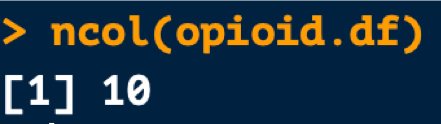
- ncol() tells you the number of columns in a data frame
- Below we see that opioid.df has 10 columns
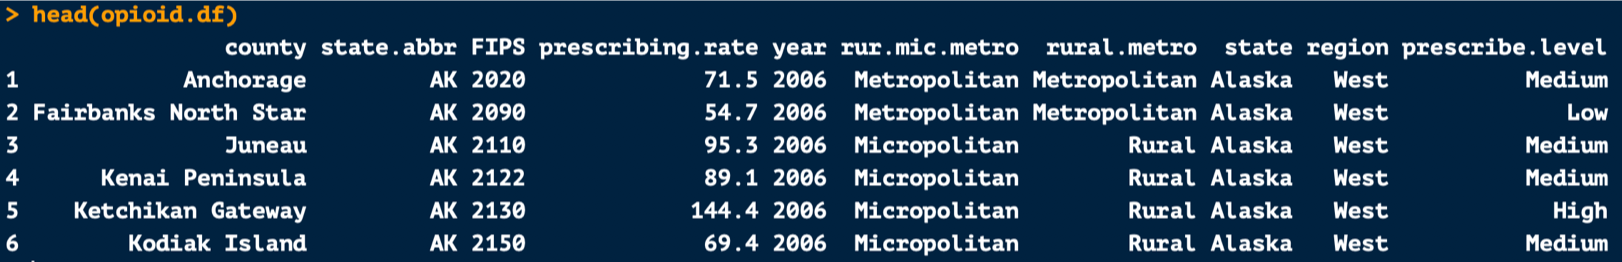
Viewing the First and Last Rows in a Data Frame
- head() and tail() help give you a birds eye view of a data frame by showing you the first and last rows
- By default, the first 6 rows will be shown
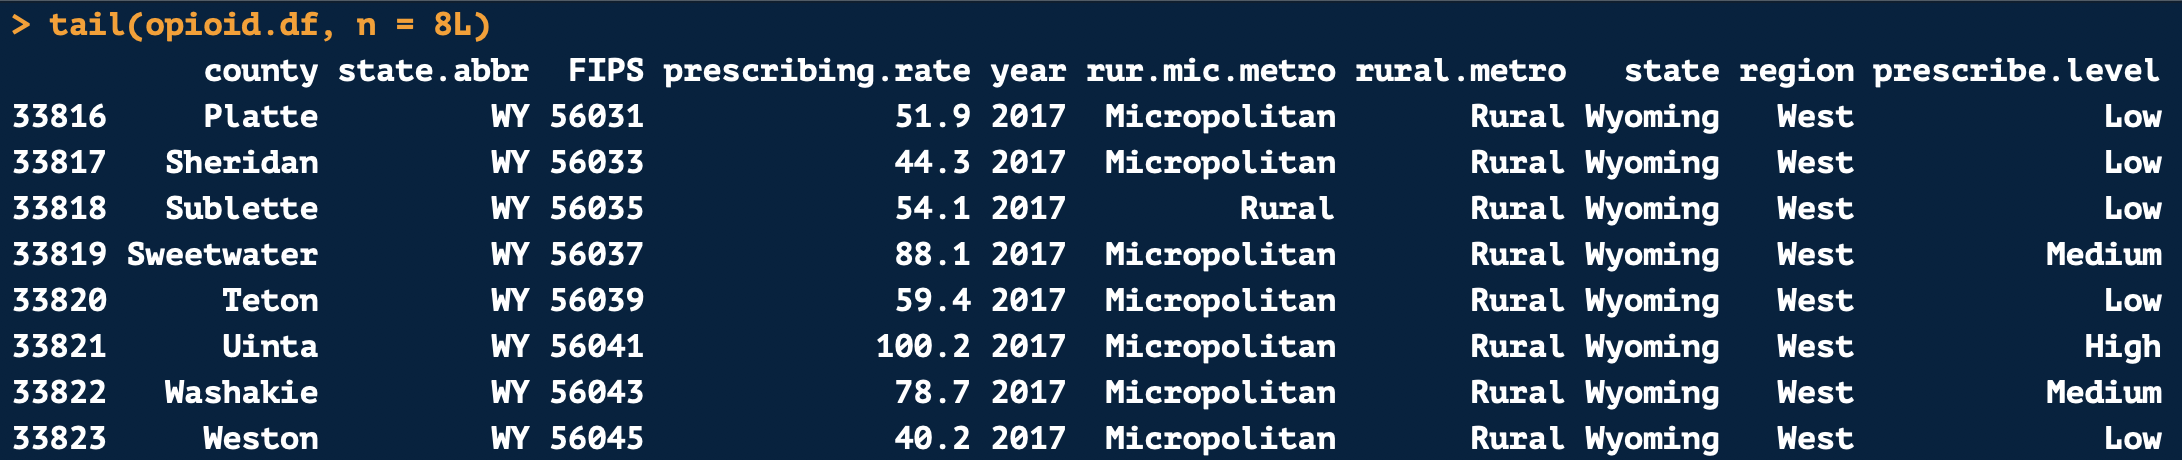
- The number of rows shown can be changed
- For example, if the argument n = 8L is added to the head() or tail() functions, 8 rows will be displayed instead of 6